Downtown Bozeman Airbnb Investment Guide
Bozeman’s highest-demand STR pocket. Main Street’s dining and gallery blocks, the historic Hotel Baxter, and a walk-everywhere guest experience — and the numbers show it.
Real Owners. Real Numbers.
Anyone can promise you “more revenue.” So we won’t. Instead, watch two Venturebnb owners explain — on camera, in their own words — exactly what changed when Venturebnb took over their properties. It’s the same playbook we run in Bozeman.
Two unscripted interviews · filmed with real clients
Joe and Ben both started exactly where you are now — with the same free revenue audit. Ten minutes. Your address, your Bozeman comps, your number. Then you decide.
Get Your Free Revenue AuditFree · No obligation · Louisville-local team
Why Downtown Leads Bozeman STR Revenue
Downtown Bozeman is the single most requested location in the market. Guests flying into BZN for Yellowstone, Big Sky, or Bridger Bowl overwhelmingly want the same thing: a walkable base on or near Main Street, with Wild Crumb pastries, Blackbird dinners, and gallery-row evenings outside the front door. That preference translates directly into the city’s highest nightly rates.
Average daily rates downtown run roughly $300 to $420 — well above the $260–$305 citywide average — and occupancy holds 65 to 75 percent across a double-peaked calendar: summer park traffic from June through September, then ski season from December through March. MSU events, Music on Main, and the Christmas Stroll fill most of the gaps between peaks.
The catch is supply. Downtown’s zoning is the most STR-permissive in Bozeman, but every new city permit still runs through the primary-residence framework, which keeps investor inventory structurally scarce. For owners who hold an eligible property — a Main Street condo, a Bon Ton historic home with an ADU — scarcity is precisely what protects the premium.
The Three Top Airbnb Zones in Downtown Bozeman
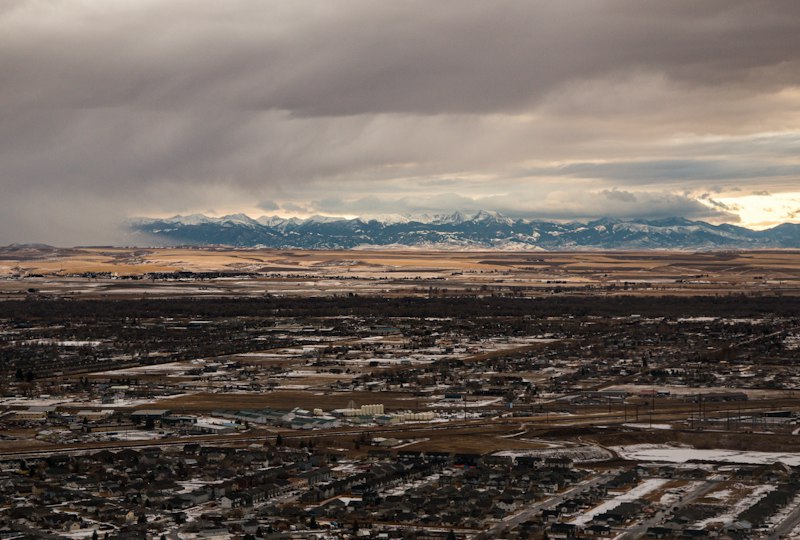 Main Street Core
Condos and lofts on or within two blocks of Main Street command Bozeman’s top nightly rates. Guests pay for zero-drive access to restaurants, breweries, and the Ellen Theatre, and event weekends push rates aggressively higher. Inventory is thin and mostly condo-format — which is exactly why it prices the way it does.
 Historic District
The tree-lined historic blocks south of Main hold Bozeman’s prettiest Craftsman and Victorian housing stock. Homes here suit the Type 1 and ADU (Type 2B) permit paths well, and guests consistently rate the porch-and-garden character above generic new builds.
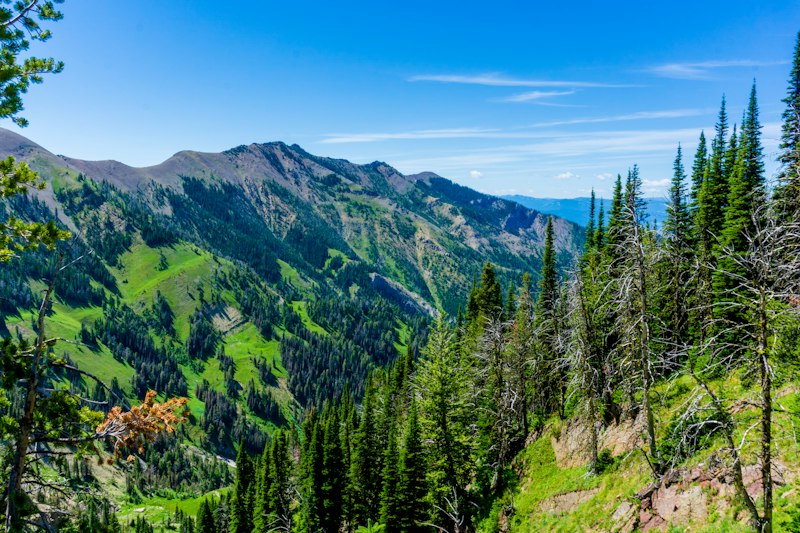 East Side
The eastern edge of downtown borders Lindley Park, Peets Hill, and the Gallagator Trail. It trades a few dollars of ADR for larger lots and easier parking, and it is the natural first stop for guests splitting time between town and the mountains.
Downtown Bozeman STR Performance by Zone
Data anchored to AirDNA and AirROI Bozeman benchmarks (2026). Zone-level figures are Venturebnb estimates; individual property results vary by unit size, configuration, and management quality. Comparing areas? See the full Best Areas for Airbnb in Bozeman guide.
| Zone | Avg ADR | Occupancy | Est. Monthly Revenue | Demand Driver |
|---|---|---|---|---|
| Main Street Core | $330–$420 | 68–78% | $5,800–$6,900 | Dining, nightlife, walkability |
| Bon Ton & South Tracy | $300–$390 | 64–74% | $5,000–$6,100 | Historic character, ADU potential |
| East Main & Lindley Park | $290–$370 | 62–72% | $4,700–$5,700 | Trails, parks, event spillover |
| Bozeman Market Average | $260–$305 | 55–65% | $3,600–$4,500 | Mixed city-wide |
Find Your Fit in Downtown Bozeman
Downtown Bozeman suits a range of investor objectives. Here is how different strategies map to the area.
The High-ADR Maximiser
Focused on top-line revenue per night. Main Street Core is the target: the strongest nightly rates in Downtown Bozeman, peak-season surge pricing, and guests who expect (and pay for) a premium experience.
The Steady-Yield Seeker
Wants consistent occupancy and predictable cash flow over cyclical peaks. Bon Ton & South Tracy delivers the steadiest booking calendar in Downtown Bozeman, smoothing the seasonal swings that define Montana markets.
The Value-Add Investor
Targeting below-market entry prices with upside via renovation and management optimisation. East Main & Lindley Park offers the most accessible acquisition costs in Downtown Bozeman with clear room to push revenue.
The Ski-Season Specialist
Builds the year around winter. East Main & Lindley Park (Bridger access) captures Bozeman’s ski demand — Big Sky and Bridger Bowl money — with powder-week pricing that behaves like event nights in a city market.
The House-Hacker
Lives in the property and rents legally under Bozeman’s primary-residence rules — rooms (Type 1) or an ADU (Type 2B). Bon Ton & South Tracy (ADU lots) is where that strategy earns most per square foot.
The Portfolio Diversifier
Adding a Mountain-West asset to an existing STR portfolio. Main Street Core pairs durable two-season demand with the supply constraints that protect long-run rates in the Bozeman market.
How We Maximise Downtown Bozeman Revenue
Three integrated systems, built for Bozeman’s double-peaked, compliance-heavy STR calendar.
Season-Driven Dynamic Pricing
Our pricing engine tracks the whole Bozeman demand stack in real time — Big Sky and Bridger Bowl snow reports, Yellowstone season openings, MSU’s event calendar, and BZN flight loads — and updates rates daily, sometimes multiple times per day. Powder weeks, graduation, and summer park season each behave differently; most self-managed owners leave 20 to 30 percent of peak-season revenue on the table by adjusting too slowly.
Bozeman-Local Operations Team
Every check-in, maintenance call, and 2 a.m. hot-tub question is handled by a team physically based in Bozeman. We know which plow contractor actually shows up before a powder-day checkout, which cleaning crews can turn a canyon home between back-to-back ski weeks, and how to run properties through minus-twenty cold snaps without frozen-pipe surprises.
Compliance-First Listing Management
In the tightest regulatory market in the Mountain West, compliance is a revenue strategy. We manage the full stack — city permit renewals and fire-inspection cycles, primary-residence certifications, state and county registrations, resort-tax filings in Big Sky, and the permit numbers your listings are legally required to display — so your rental never risks the lapsed-permit trap that permanently ends grandfathered operations.
The Numbers Behind Downtown Bozeman
Key data points from primary industry sources underpinning the Downtown Bozeman STR investment case.
Record BZN Airport Passengers
Bozeman Yellowstone International Airport served a record 2,809,419 passengers in 2025, up 6.3% year-over-year — the busiest airport in Montana and the front door for virtually every Big Sky and Yellowstone trip.
Yellowstone Visitors in 2025
Yellowstone National Park logged 4,762,988 visits in 2025, its second-highest year ever. Bozeman is the largest city serving the park’s north and west entrances, and summer demand spills directly into local rentals.
Total Lodging Tax — and 0% Sales Tax
Montana charges a combined 8% state lodging tax on stays under 30 nights and no general sales tax. Guests’ all-in price stays lower than in most U.S. markets, which supports stronger headline nightly rates.
Annual City STR Registration
Inside city limits every short-term rental carries a $325 annual registration, a fire inspection current within three years, and an annually re-signed primary-residence certification. We handle the whole cycle for our owners.
Active Bozeman STR Listings
AirROI tracks roughly 717 active short-term rentals in Bozeman proper — a small, supply-constrained market where the city’s primary-residence rules keep new competition structurally limited.
One of America’s Fastest-Growing Small Metros
Bozeman has ranked among the fastest-growing micropolitan and small-metro areas in the United States for most of the last decade, compounding housing demand, visitor demand, and long-term appreciation.
Downtown Bozeman Airbnb Permits — What You Need to Know
Downtown’s commercial and mixed-use districts (B-3 core and the B-2M blocks around it) allow the widest set of STR types in Bozeman — unlike the residential RA district, where only host-occupied Type 1 rentals survive the 2026 code change. Every new permit still runs through the city’s primary-residence framework, and zoning is parcel-specific, so verify any address with the city’s Community Development Viewer before you buy. Here is what every Downtown operator needs to know.
Annual City Registration
Every Bozeman STR carries a $325 annual registration through the city’s STR Permit Portal. Permits renew every year — and the deadline has teeth: a lapsed permit can permanently end a grandfathered or Legacy operation. Fire inspections repeat every three years.
The February 2026 District Change
Bozeman’s new Unified Development Code merged the former RS, R1, and R2 districts into a single RA district where only host-occupied Type 1 rentals are permitted. If a property sits in a former R1/R2 neighborhood, verify its current district before assuming anything.
Type 1, 2A, and 2B
Type 1: rent rooms in your home while you live there. Type 2A: rent your whole primary residence while you’re away. Type 2B: rent an ADU on your lot or one unit in your building. All three require the home to be your primary residence — the ADU path (2B) is the main income route left for new operators.
The Primary-Residence Rule
Every new permit type requires the home to be your primary residence, occupied at least 70% of the calendar year, certified on a city form annually — not once. This single rule is what ended investor-style STRs inside Bozeman city limits.
Montana Lodging Taxes
Stays under 30 nights collect a combined 8% in state lodging taxes, registered and filed through the Montana Department of Revenue. Bozeman adds no city lodging tax, and Montana has no general sales tax — guests’ all-in pricing stays competitive.
Type 3 & the Legacy Trap
New non-owner-occupied (Type 3) permits have been banned citywide since December 2023. Existing ones survive only as “Legacy Type 3” — and Legacy status does not transfer when a property sells. A “turnkey Airbnb” listing whose permit dies at closing is the most expensive trap in this market.
Find Out What Your Downtown Bozeman
Property Can Earn.
Our Bozeman team will prepare a free, property-specific revenue estimate based on your unit’s location, size, and configuration — no obligation, no sales pressure. Just the numbers.
Research & Data References
Research & Data References
Downtown Bozeman Airbnb Investment Guide, Last reviewed August 2026
- 1.City of Bozeman — Short-Term Rental ProgramOfficial source for Bozeman STR permit types (Type 1, 2A, 2B, Legacy Type 3), the $325 annual registration fee, the February 2026 Unified Development Code and RA district rules, primary-residence certification, and the permit application process. bozemanmt.gov
- 2.Montana Department of Revenue — Lodging TaxesRegistration and filing authority for the combined 8% Montana lodging facility use and lodging sales taxes collected on stays under 30 nights, and for Sales and Use Tax permits (account IDs ending in “LFT”). mtrevenue.gov
- 3.AirDNA MarketMinder — Bozeman, MTShort-term rental market intelligence for Bozeman: average daily rate, occupancy, and revenue benchmarks across active Airbnb and Vrbo listings. airdna.co
- 4.AirROI — Bozeman Market ReportIndependent STR data platform reporting Bozeman listing counts, ADR, occupancy, and average annual host revenue (trailing twelve months). airroi.com
- 5.Bozeman Yellowstone International Airport — 2025 Year-End ReportOfficial passenger statistics: a record 2,809,419 passengers served in 2025, up 6.3% over 2024 — the busiest airport in Montana and the primary air gateway to Big Sky and Yellowstone. bozemanairport.com
- 6.National Park Service — Yellowstone Visitation StatisticsYellowstone National Park recorded 4,762,988 visits in 2025, its second-highest year on record, with 1.2 million overnight stays inside the park. nps.gov