
East Nashville Airbnb Investment Guide
Nashville’s largest STR sub-market with 2,019 active listings. Five Points, Lockeland Springs, and Inglewood attract the authentic Nashville traveller, 3BR properties track 9.51% gross yield (Airbtics, March 2026).
Get Your Free Revenue EstimateReal Owners. Real Numbers.
Anyone can promise you “more revenue.” So we won’t. Instead, watch two Venturebnb owners explain — on camera, in their own words — exactly what changed when Venturebnb took over their properties. It’s the same playbook we run in Nashville.
Two unscripted interviews · filmed with real clientsJoe and Ben both started exactly where you are now — with the same free revenue audit. Ten minutes. Your address, your Nashville comps, your number. Then you decide.
Get Your Free Revenue AuditFree · No obligation · Louisville-local team
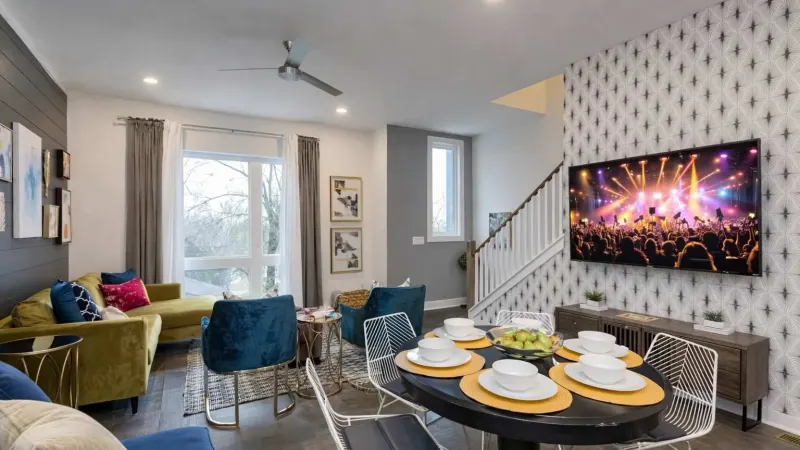
East Nashville: Nashville's Premier STR Sub-Market
East Nashville commands Nashville's largest short-term rental sub-market, with 2,019 active listings recorded by Airbtics as of March 2026, more than any other zone across Davidson County's 8,300 total active STRs. The neighbourhood's appeal is rooted in authenticity: the Five Points corridor and Shelby Avenue strip anchor a walkable, arts-forward district lined with independent music venues including The 5 Spot and Basement East, while acclaimed restaurants such as Husk, Folk, and Henrietta Red draw visitors who seek something beyond the Broadway honky-tonk corridor. Lockeland Springs adds a quieter, bungalow-lined residential character favoured by long-stay guests and families, while Inglewood and the Riverside pocket deliver an emerging value proposition with proximity to the Cumberland River. Together these micro-neighbourhoods sustain an average daily rate range of $175–$375 and occupancy running 68–80% across property types (BNBCalc, 2024).
For investors focused on yield, East Nashville's 3-bedroom segment stands out across all of Nashville. Airbtics data for March 2026 records a 9.51% gross yield for 3BR properties, the highest 3BR figure tracked in any Nashville sub-market. BNBCalc's 2024 baseline supports this with a $175 average daily rate and 72% blended occupancy, translating to median host revenues near the $50K annual benchmark Airbtics reports market-wide. Entry prices for 3BR properties currently sit in the $450K–$625K range, a window that continues to attract out-of-state investors benchmarking against comparable coastal markets. Nashville drew 16.83 million visitors in 2023 (Nashville Convention & Visitors Corp, May 2024), generating $10.77 billion in visitor spending, and East Nashville captures a disproportionate share of the culturally curious, repeat-visit segment of that demand.
Three distinct investment sub-zones define East Nashville's STR landscape. Five Points/Shelby Ave represents the market's commercial heart, delivering the highest ADRs ($200–$375) and peak-month revenues up to $6,500 on 3BR properties. Lockeland Springs offers residential-scale bungalows with consistent 68–78% occupancy and a loyal guest base valuing neighbourhood character over nightlife access. Inglewood and Riverside remain the emerging pocket, $165–$250 ADR with 65–75% occupancy, positioning earlier-stage investors for appreciation upside as the zone matures. Note that non-owner-occupied (NOO) permits apply on the Main Street and Gallatin Avenue commercial strips; buyers should confirm permit eligibility with Metro Nashville prior to purchase. Venturebnb's local acquisition advisors can guide permit due diligence alongside a full revenue projection, request your free rental evaluation here.
The Three Top Airbnb Zones in East Nashville

The beating heart of East Nashville's STR market. Walkable access to The 5 Spot, Basement East, and the city's best independent restaurant row drives premium ADRs and the highest weekend demand of any East Nashville sub-zone.

Lockeland Springs delivers consistent year-round occupancy for well-presented bungalows and craftsman homes. A quieter residential setting attracts longer stays, families, and guests returning to Nashville for weddings and events.

Inglewood and the Riverside corridor represent East Nashville's best value-add opportunity, with lower entry prices, improving walkability, and growing proximity value as new restaurants and venues open along Gallatin Avenue and near the Cumberland River.
East Nashville Performance Benchmarks
Sub-zone comparison across the key performance metrics investors use to underwrite East Nashville STR acquisitions. Sources: BNBCalc 2024, Airbtics March 2026.
| Zone | ADR | Occupancy | Peak Month | Best Property Type | Key Demand Driver |
|---|---|---|---|---|---|
| Five Points / Shelby Ave East Nashville Heart | $200–$375 | 72–82% | October | 3BR Craftsman / Duplex | Music venues, restaurants, walkability |
| Lockeland Springs Residential Character | $175–$300 | 68–78% | June | 2–3BR Bungalow | Long stays, weddings, repeat visitors |
| Inglewood / Riverside Emerging Pocket | $165–$250 | 65–75% | June | 2–3BR Value-Add | Cumberland River, Gallatin Ave growth |
Find Your Fit in East Nashville
Different investment strategies perform differently across East Nashville's sub-zones. Here is how to match your goals to the right pocket.
Maximum Revenue
Prioritise a 3BR property on or near the Five Points corridor. Peak-month revenues reach $6,500+ with dynamic pricing calibrated to CMA Fest, Bridgestone Arena events, and Nashville SC match nights.
Best Gross Yield
East Nashville's 3BR properties deliver a 9.51% gross yield, the highest for that bedroom count in all of Nashville (Airbtics, March 2026). Entry prices of $450K–$625K underwrite strongly against comparable coastal STR markets.
Character Properties
East Nashville's craftsman bungalows and historic shotgun homes photograph exceptionally well and attract design-conscious guests willing to pay a premium. Lockeland Springs bungalows consistently outperform generic condos on a per-square-foot revenue basis.
Event-Driven Demand
East Nashville sits adjacent to downtown's 150+ annual Bridgestone Arena events, CMA Fest (June), CMA Awards (November), Nashville SC at GEODIS Park, and Music City Center conventions. Weekend surge pricing adds 30–55% above base rates during peak event weekends.
Corporate & Business Travel
Mid-week occupancy in East Nashville benefits from proximity to downtown Nashville's corporate core and the Music City Center convention calendar. Well-appointed 1–2BR properties near Gallatin Ave attract business travellers seeking more space than a hotel room.
Long-Stay & Families
Lockeland Springs and Inglewood attract families and relocating professionals booking 7–30 night stays. Lower nightly rates are offset by zero turnovers and higher monthly net, ideal for investors seeking management simplicity alongside steady yield.
The East Nashville STR Management System
Three interlocking capabilities that protect your yield and remove every management burden from your plate.
Dynamic Pricing
Our pricing engine is calibrated to Nashville's full event calendar, CMA Fest (June), CMA Awards (November), Bridgestone Arena's 150+ annual events, Nashville SC home matches at GEODIS Park, and Music City Center conventions. We layer in East Nashville-specific triggers: The 5 Spot residencies, Basement East headline nights, and Shelby Bottoms events that move local demand. Rates adjust daily so your property captures every surge without leaving occupancy on the table in shoulder weeks.
Full-Service Management
Professional photography and listing optimisation on Airbnb, Vrbo, and direct channels. 24/7 guest communications from inquiry through checkout. Professional housekeeping turnovers with quality-control photo sign-off after every stay. Maintenance coordination through our vetted East Nashville contractor network. Everything is handled locally, you receive a monthly owner statement and nothing else lands on your calendar.
STR Compliance
Metro Nashville requires a Type 1 (owner-occupied) or Type 2 (non-owner-occupied) STR permit at $313 per year, a local responsible party residing within 25 miles of the property, and Hotel Occupancy Tax remittance (7% city/county tax plus $2.50 per night) by the 20th of the following month. We handle permit applications, renewals, local-party coverage, and monthly tax remittance as a standard part of our management service, full compliance, fully managed.
East Nashville by the Numbers
The macro demand story behind Nashville's best-performing STR sub-market.
Nashville Visitors in 2023
Nashville welcomed 16.83 million visitors in 2023, sustaining the demand base that underpins East Nashville's 2,019-listing STR market. Source: Nashville Convention & Visitors Corp, May 2024.
Median Annual STR Host Revenue
The median Nashville short-term rental host earned $50,000 in annual revenue across Davidson County, with East Nashville 3BR properties tracking above this benchmark. Source: Airbtics, March 2026.
Gross Yield, 3BR Properties
East Nashville 3-bedroom properties record a 9.51% gross yield, the highest 3BR figure tracked in any Nashville sub-market, against an entry price range of $450K–$625K. Source: Airbtics, March 2026.
Nashville Visitor Spending 2023
Nashville visitors spent $10.77 billion in 2023, producing the deep hospitality demand that supports premium ADRs across East Nashville's Five Points and Lockeland Springs sub-zones. Source: Nashville Convention & Visitors Corp, May 2024.
Annual STR Permit Fee
Metro Nashville charges $313 per year for both Type 1 (owner-occupied) and Type 2 (non-owner-occupied) STR permits, one of the more accessible regulatory frameworks among major US cities. Source: Nashville.gov.
Active Nashville STR Listings
Davidson County hosts approximately 8,300 active STR listings, with East Nashville's 2,019 making it the single largest sub-market zone, roughly 24% of all Nashville short-term rentals. Source: Airbtics, March 2026.
East Nashville Airbnb Permits — What You Need to Know
Most of East Nashville carries residential zoning (R/RS), where Metro no longer issues new non-owner-occupied STRP permits—here the play is an owner-occupied permit, a grandfathered NOO property, or a parcel along the Gallatin Pike and Main Street mixed-use corridors. Zoning is parcel-specific, so verify any address with Metro Planning before you buy. Here is what every East Nashville operator needs to know.
Annual STRP Permit
Every Nashville short-term rental must hold a Short Term Rental Property (STRP) permit from Metro Codes before it can be listed or advertised. The application fee is $313 per year, the permit expires 365 days after issue, and renewals require proof that all property, occupancy, and sales taxes have been paid.
Owner-Occupied vs. Non-Owner-Occupied
Owner-occupied permits require the owner to permanently live on the property and are issued to natural persons only—LLCs, corporations, and trusts are ineligible. New non-owner-occupied permits are prohibited in residential zones (AR2A, R, RS, RM) and issued only in mixed-use, office, commercial, and downtown districts (MUN/MUL/MUG/MUI, OG, OR20–OR40-A, ORI, CN/CL/CS/CA/CF, DTC, SCN/SCC/SCR).
Application Requirements
Applications go through Metro ePermits and require homeowner’s fire, hazard, and liability insurance of at least $1 million per occurrence, a floor plan certified by a licensed architect, engineer, or home inspector, a notarized affidavit, proof of paid taxes, written notification to adjacent property owners, and an HOA compliance statement where applicable.
Occupancy & Operating Rules
A permit covers up to 4 sleeping rooms; maximum occupancy is twice the number of permitted sleeping rooms plus four, capped at 12 guests. The permit number must appear on every listing, and a responsible party located within 25 miles must be reachable 24/7 and posted inside the unit.
Lodging Taxes
Metro’s hotel occupancy tax is 7% of gross receipts plus $2.50 per occupied night (raised from 6% in July 2023 under ordinance BL2022-1529), on top of 9.25% combined state and local sales tax. Airbnb and Vrbo remit most Tennessee taxes automatically; direct bookings must be remitted to Metro.
Enforcement & Grandfathering
A permit can be revoked after three violations of any applicable ordinance. Grandfathered non-owner-occupied permits in residential zones can be renewed but are non-transferable—they are extinguished when the property is sold, which is why permitted properties command a price premium.
Sources: Nashville.gov — STRP Permit Types · STRP Application Requirements · Operation Rules · Metro Finance — Occupancy Tax. Rules verified August 2026. Venturebnb handles permit applications, renewals, and tax remittance for every property we manage.
Find Out What Your East Nashville Property Can Earn.
East Nashville's Five Points corridor, Lockeland Springs bungalows, and Inglewood's emerging pocket each carry distinct revenue profiles. Tell us your address and we will model your projected ADR, occupancy, and annual revenue, based on real comparable data, managed by Nashville's most experienced STR team.
Request Your Free EvaluationResearch & Data Sources
All performance data referenced in this guide is sourced from publicly available market research and platform analytics. Figures represent estimates based on comparable properties and should be used for indicative purposes only.
Data Sources, East Nashville Airbnb Investment Guide
Last reviewed June 2026
- 1.Nashville Convention & Visitors Corp (May 2024)Annual Nashville visitor volume (16.83M) and total visitor spending ($10.77B) for 2023. Primary demand-side data underpinning STR market projections throughout this guide. visitmusiccity.com
- 2.Airbtics (March 2026)Active listing counts by sub-market (East Nashville: 2,019; Davidson County total: 8,300), median annual host revenue ($50K), and 3BR gross yield by sub-market (East Nashville: 9.51%). airbtics.com
- 3.BNBCalc (2024)East Nashville blended average daily rate ($175) and occupancy rate (72%) baseline data used for sub-zone benchmarking throughout this guide. bnbcalc.com
- 4.STRSearch (2024–2025)Short-term rental market intelligence data for sub-zone ADR and occupancy ranges across Five Points, Lockeland Springs, and Inglewood. strsearch.com
- 5.Metro Nashville, Nashville.gov (Current)Official Metro Nashville STR permit requirements, Type 1 and Type 2 classifications, $313 annual permit fee, local responsible party requirement (within 25 miles), and Hotel Occupancy Tax obligations. nashville.gov
- 6.Rakidzich.com (2026)Nashville STR market analysis and sub-zone neighbourhood breakdowns referenced for East Nashville sub-market characterisation. rakidzich.com